- What it is
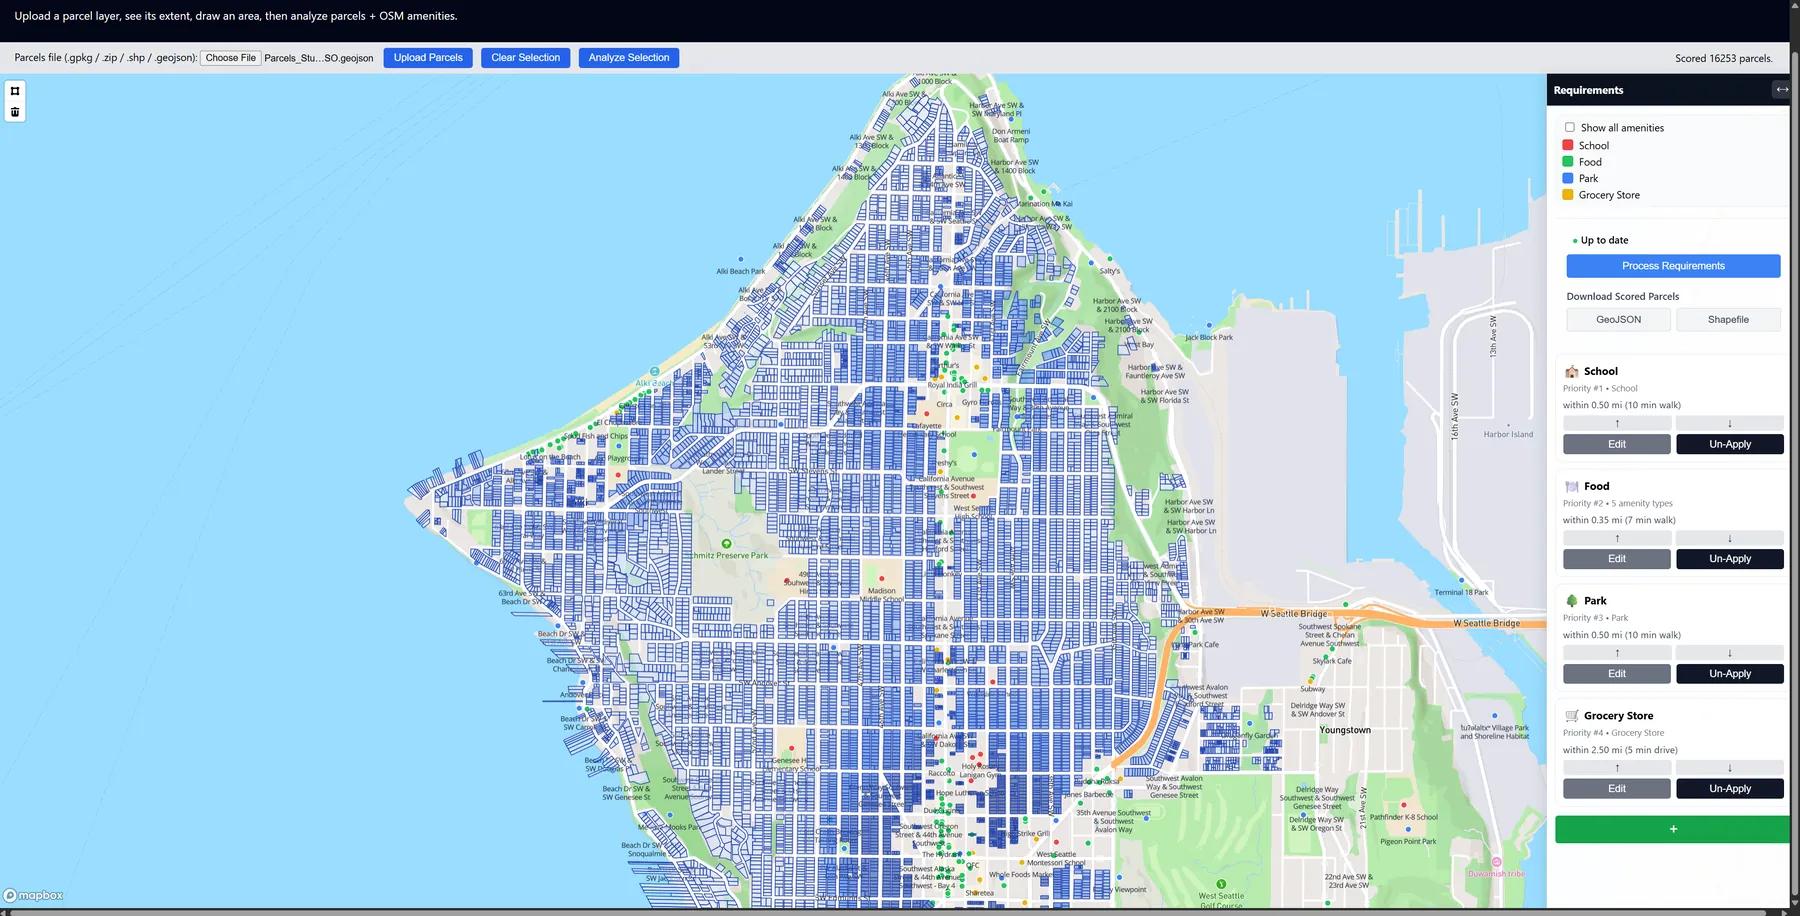
- A web map that scores every home in part of Seattle by what's nearby, like restaurants, parks and trails, and shows why each one scored the way it did.
- Why I made it
- My sister was house hunting in Seattle, and her list of what mattered to her turned into my GIS class final project.
- What I did
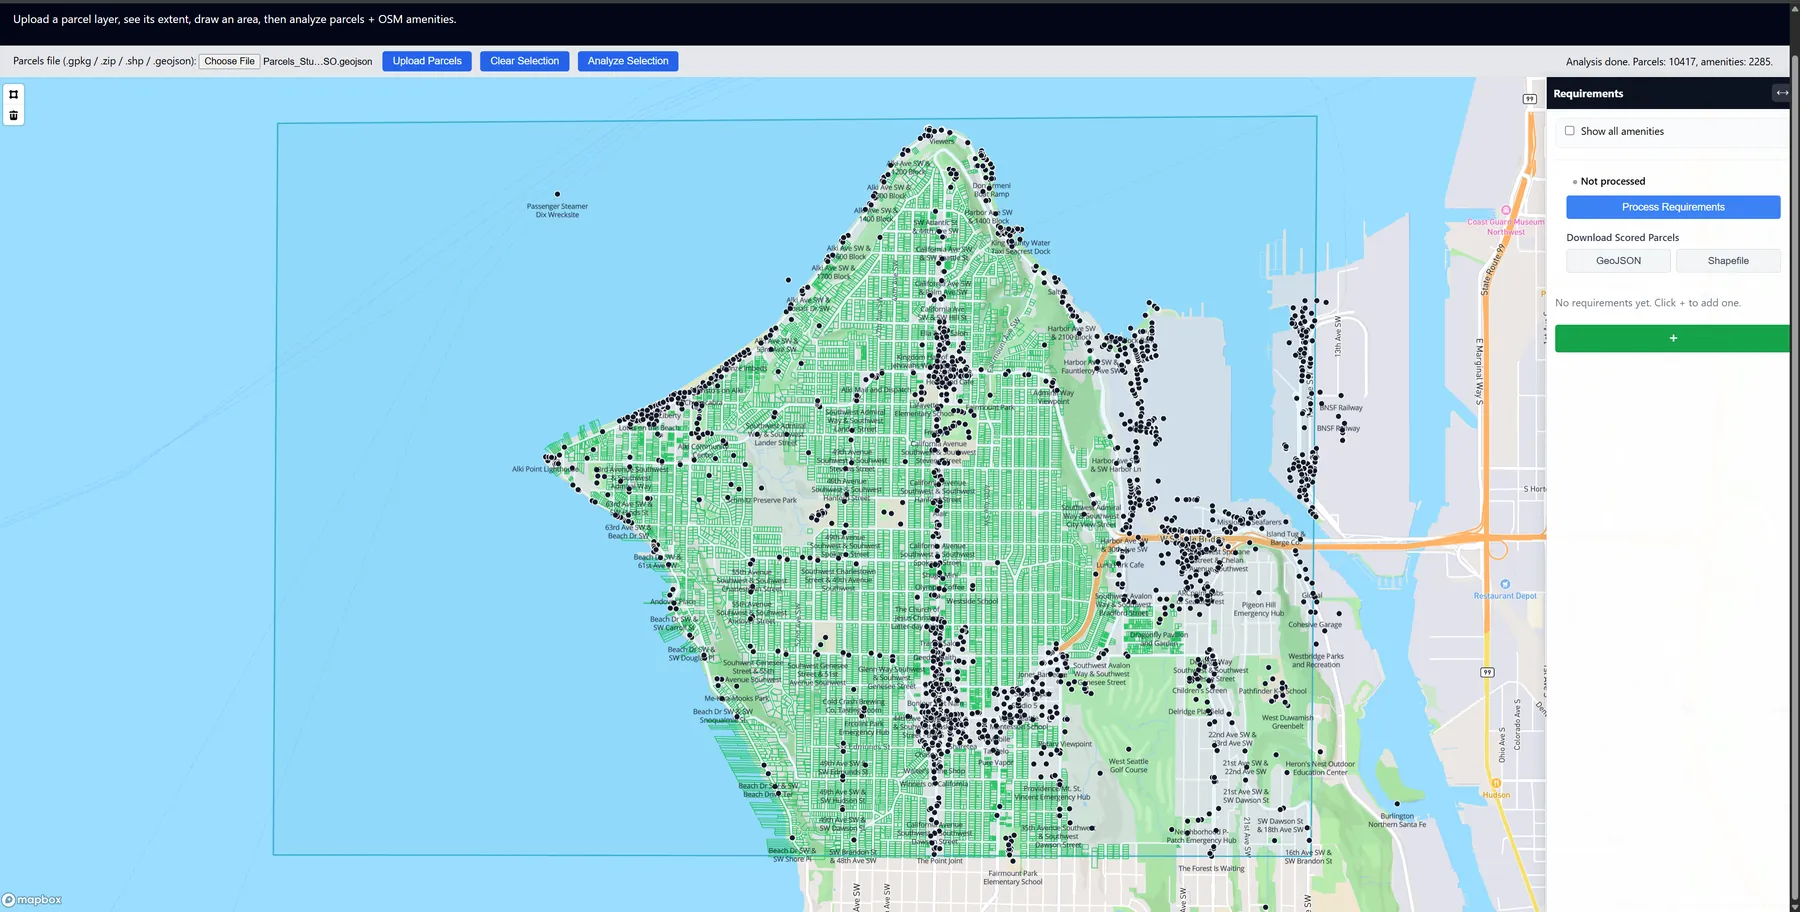
- I prepped the King County parcel data in ArcGIS Pro, then built the app with Flask, GeoPandas and Mapbox: draw an area, pull places from OpenStreetMap, rank what matters, and score the parcels.
- How it turned out
- High scores clustered in mixed-use areas near main streets, and the walking distance you pick changes the map a lot. The results export back into GIS as GeoJSON or a Shapefile.
The details
The idea
My sister was recently looking for a home in Seattle, and she told me what mattered to her: being able to walk to restaurants, getting to parks and trails, and having everyday things close by. Her list became the things I scored.
So the question I wanted to answer was: which homes in Seattle best match what someone is looking for, and how does that change across the city?
How it works
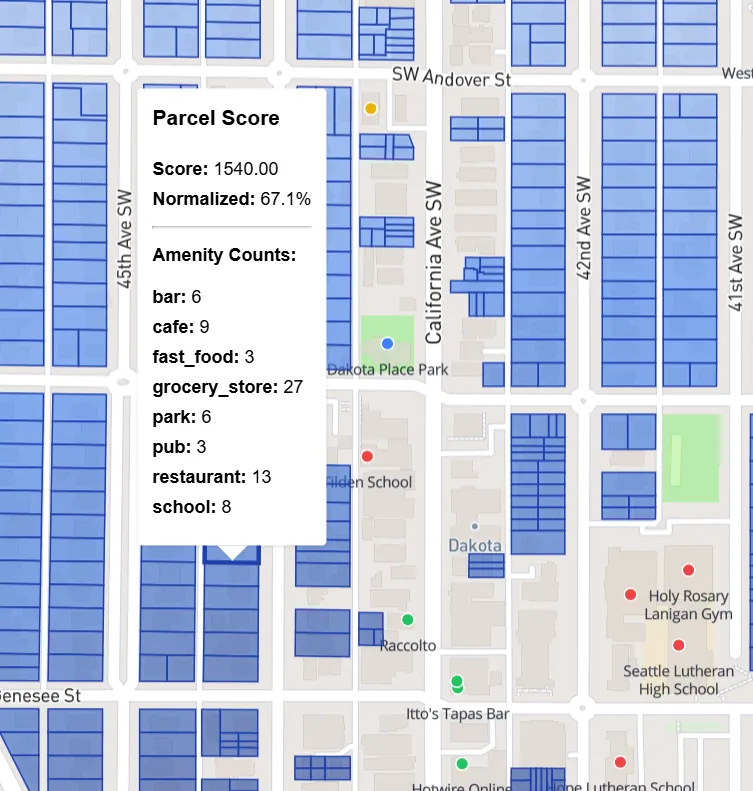
You load the parcels, draw the area you care about, grab nearby places from OpenStreetMap, set up and reorder your requirement groups, and then run the scores. Clicking a parcel shows its score and the count from each group, so you can see why it got its color instead of guessing.
For each group, the app takes the kinds of places you picked, draws a circle of the distance you chose around each one, and counts how many circles touch each parcel. Your first requirement counts the most, and each one after it counts a little less.
The full King County dataset has more than 500,000 parcels of every kind. I used ArcGIS Pro to clip it to my study area and keep only the homes before loading it into the app.
What the results showed
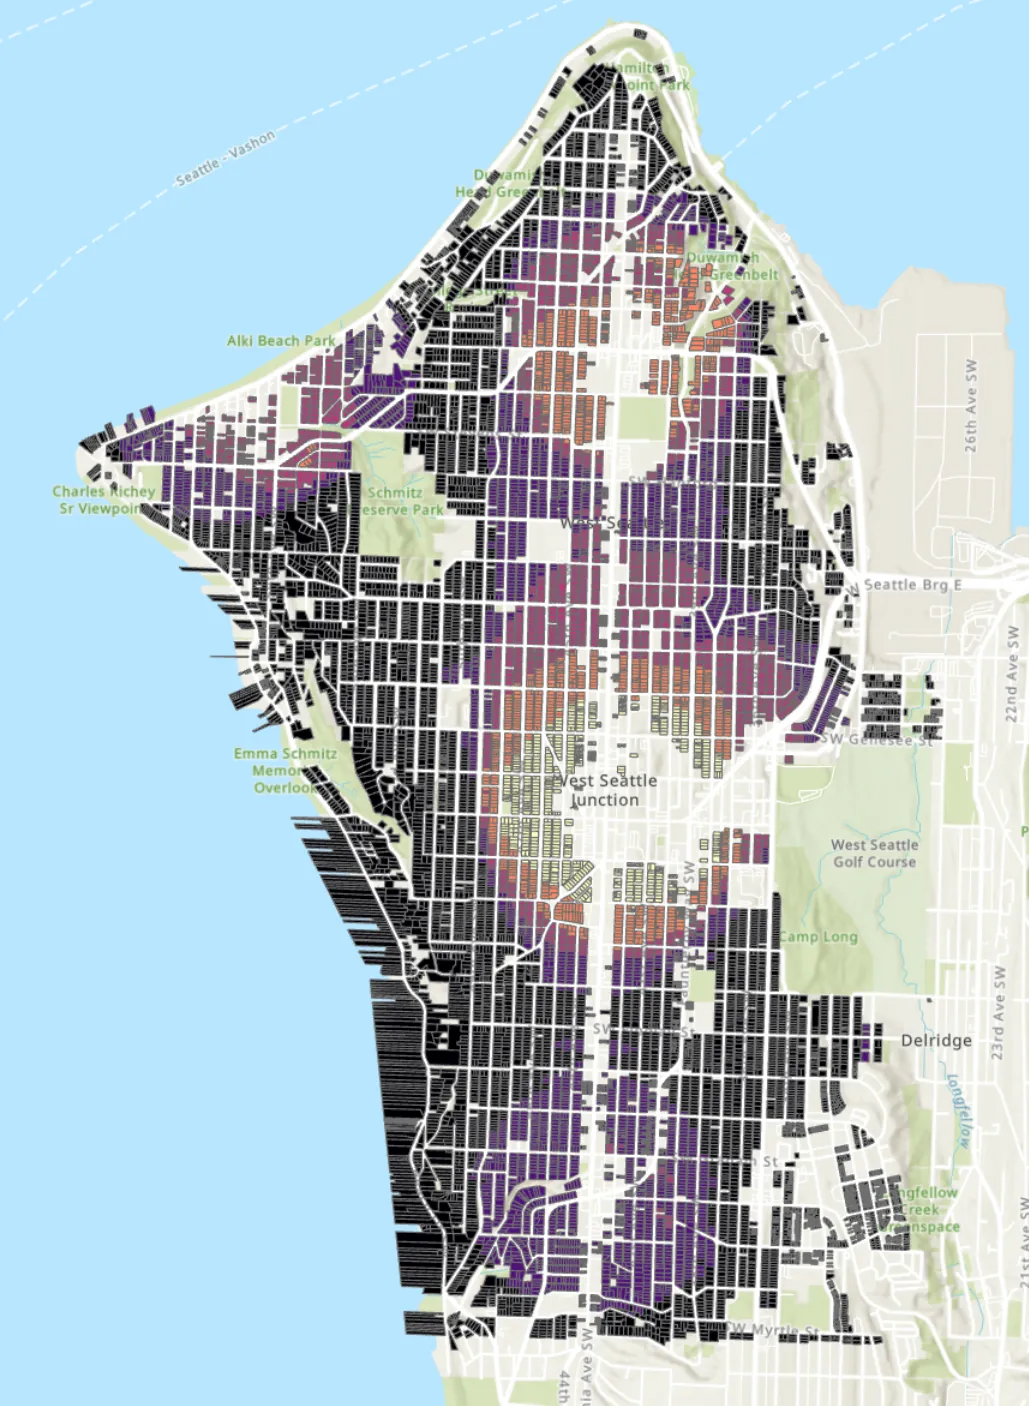
High scores showed up in clusters in mixed-use areas. Homes near main streets with a lot of restaurants scored higher, which shows where businesses are packed together.
The distance made a big difference. Short walking distances, like a quarter to half a mile, gave sharp contrast, while bigger ones spread the high scores out. When food was the top priority, homes near busy commercial streets could score really high, even though that clashes with wanting a quiet street.
The app exports the scored layer as GeoJSON or a Shapefile, so it can go right back into a GIS workflow.
Looking back
Prepping the data mattered as much as the scoring. Clipping, filtering and exporting in ArcGIS Pro is what made the app fast enough to actually use.
I also learned how much a good interface changes a GIS tool. Things that feel complicated in ArcGIS got a lot easier as a guided set of steps. It made me think about all the map tools we take for granted, like Google Maps, and how much they're planned around what you're actually trying to do.