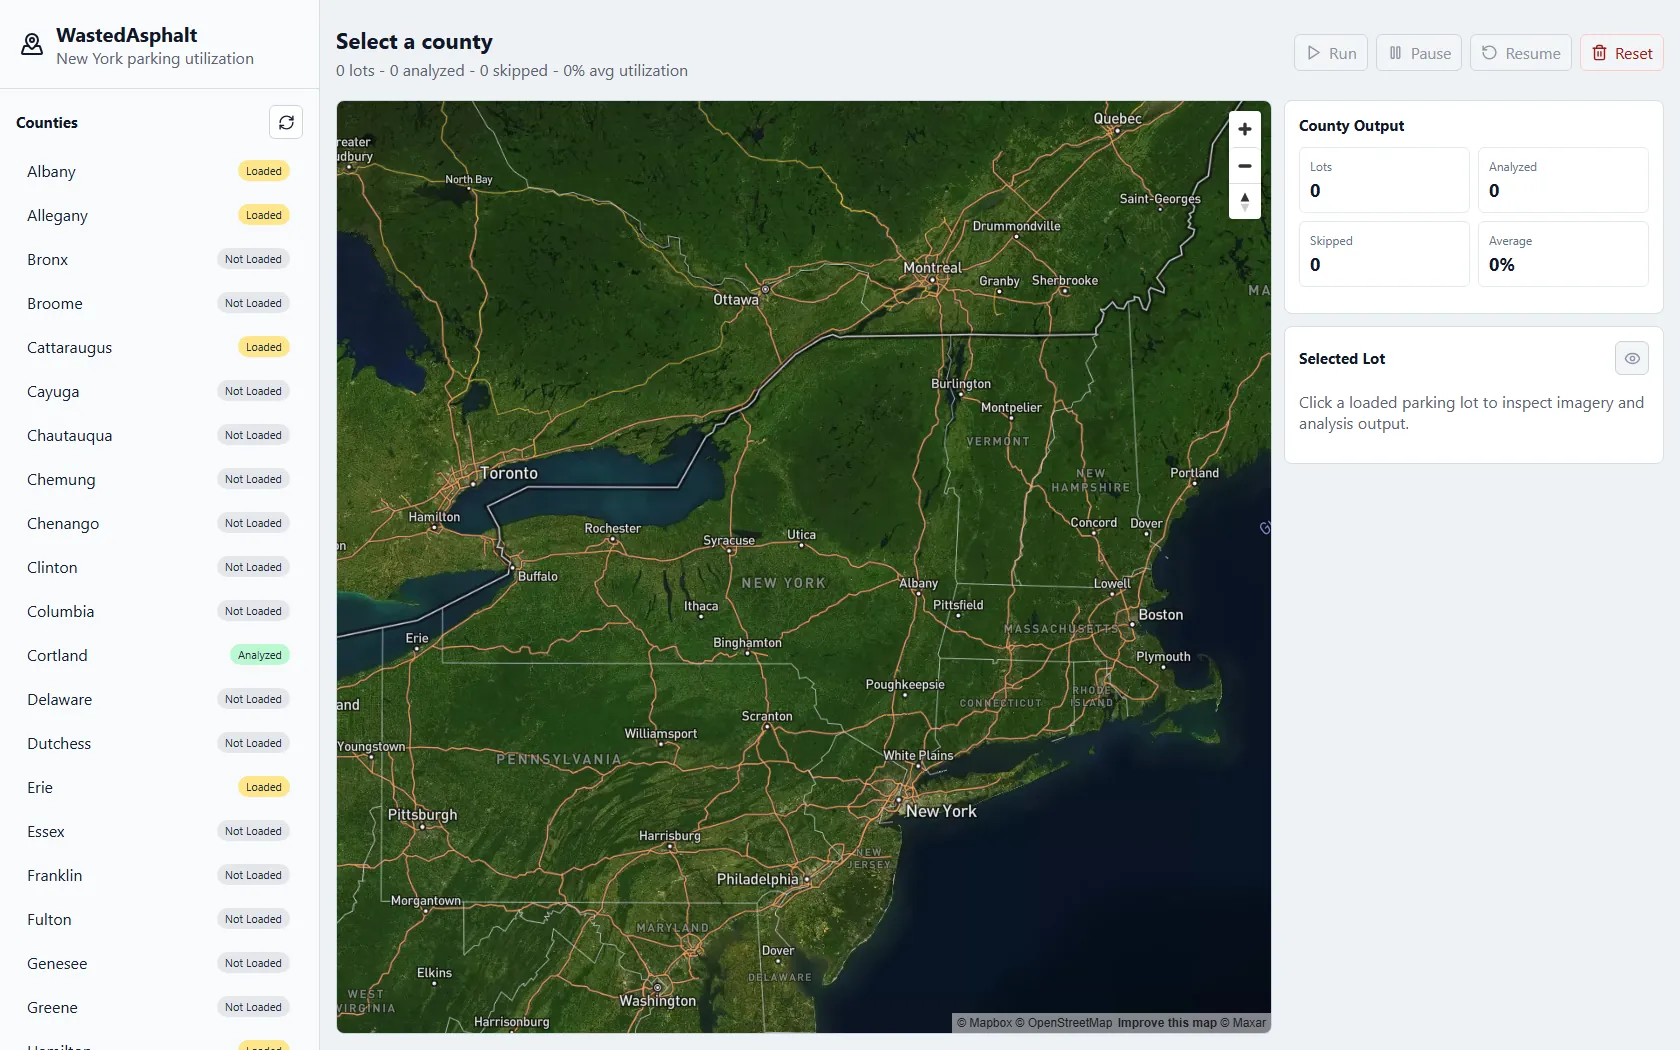
WastedAsphalt is a local web app for analyzing parking-lot utilization across New York counties. It pulls parking polygons from OpenStreetMap, downloads Mapbox satellite imagery, estimates visible utilization with a classical image-analysis pipeline, and exports ArcGIS-friendly results. Its persistent job system lets long county runs pause, resume, and recover after a restart.
What the app does
The app loads New York county boundaries from the local 2025 TIGER/Line shapefile and displays them on a Mapbox satellite-streets map. Pick a county and it queries Overpass for OpenStreetMap parking polygons, clips them to the county, and skips underground, multi-storey, rooftop, covered, and other lots that cannot be analyzed well from above.
For each analyzable lot, it downloads and caches a Mapbox satellite image, aligns the parking polygon with that image, and estimates how much of the visible paved area is occupied. The map, raw image, analysis overlay, utilization ratio, and confidence can all be inspected one lot at a time.
Monroe County example
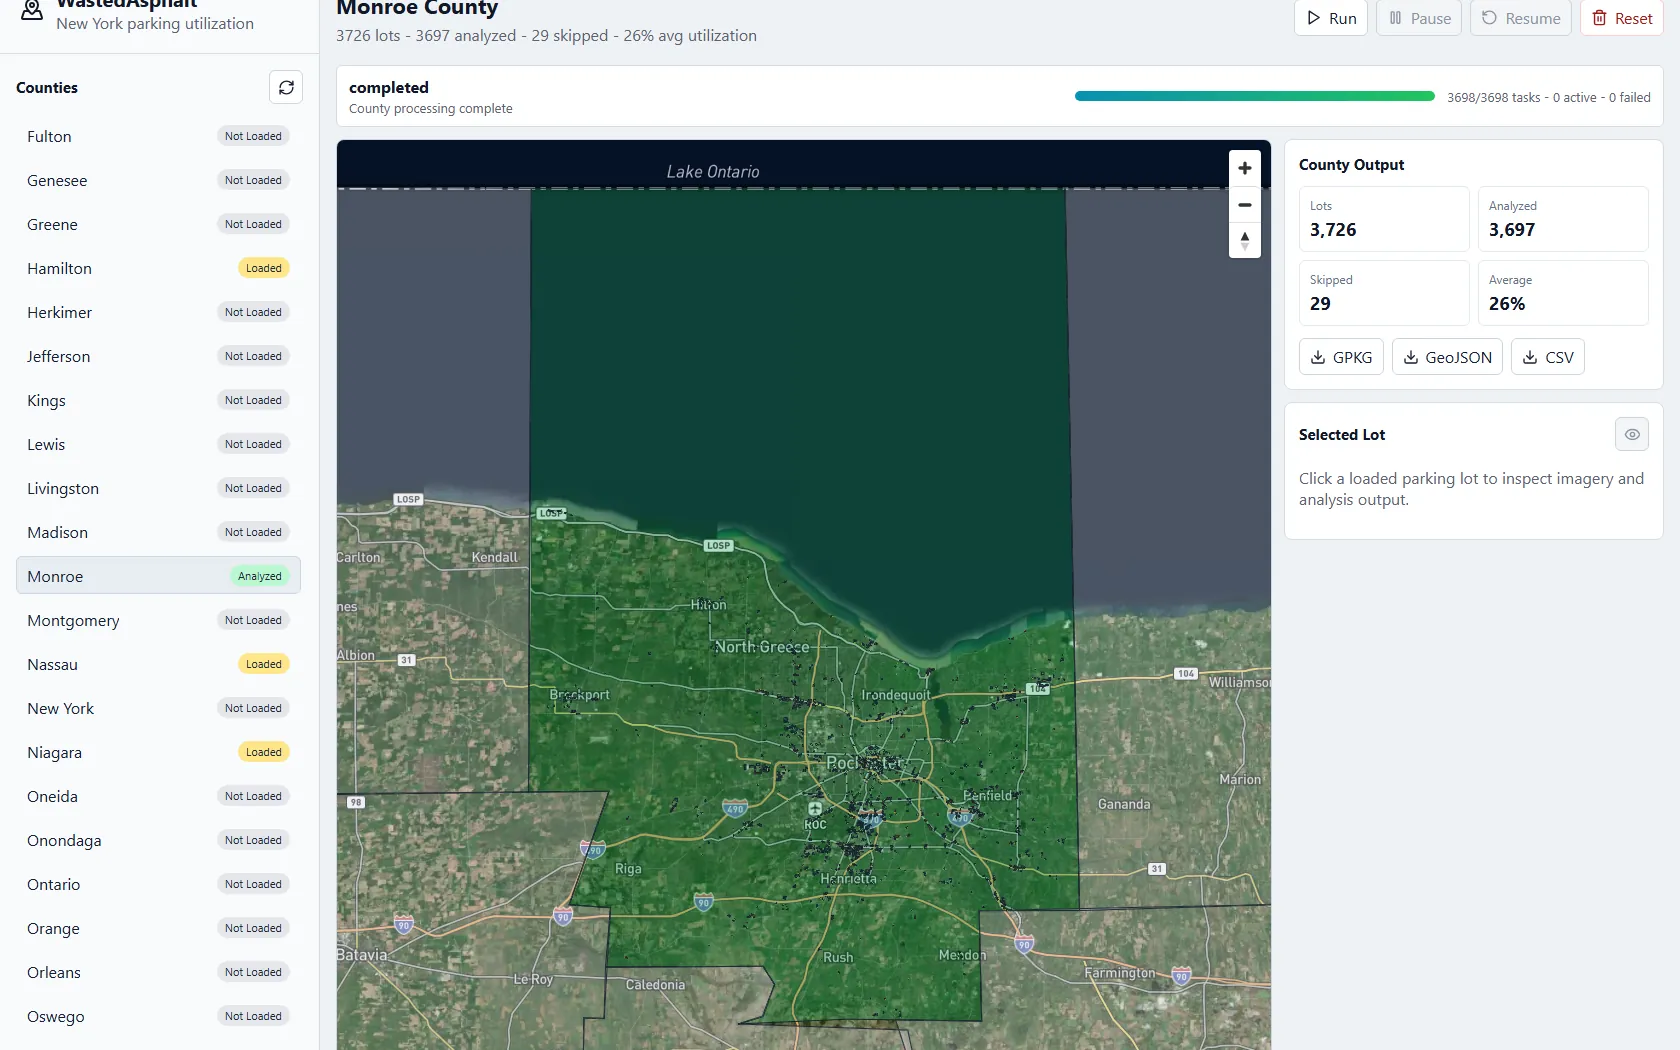
The completed Monroe County run contains 3,726 parking lots. It analyzed 3,697, skipped 29, completed all 3,698 job tasks with no failures, and estimated an average utilization of 26%.
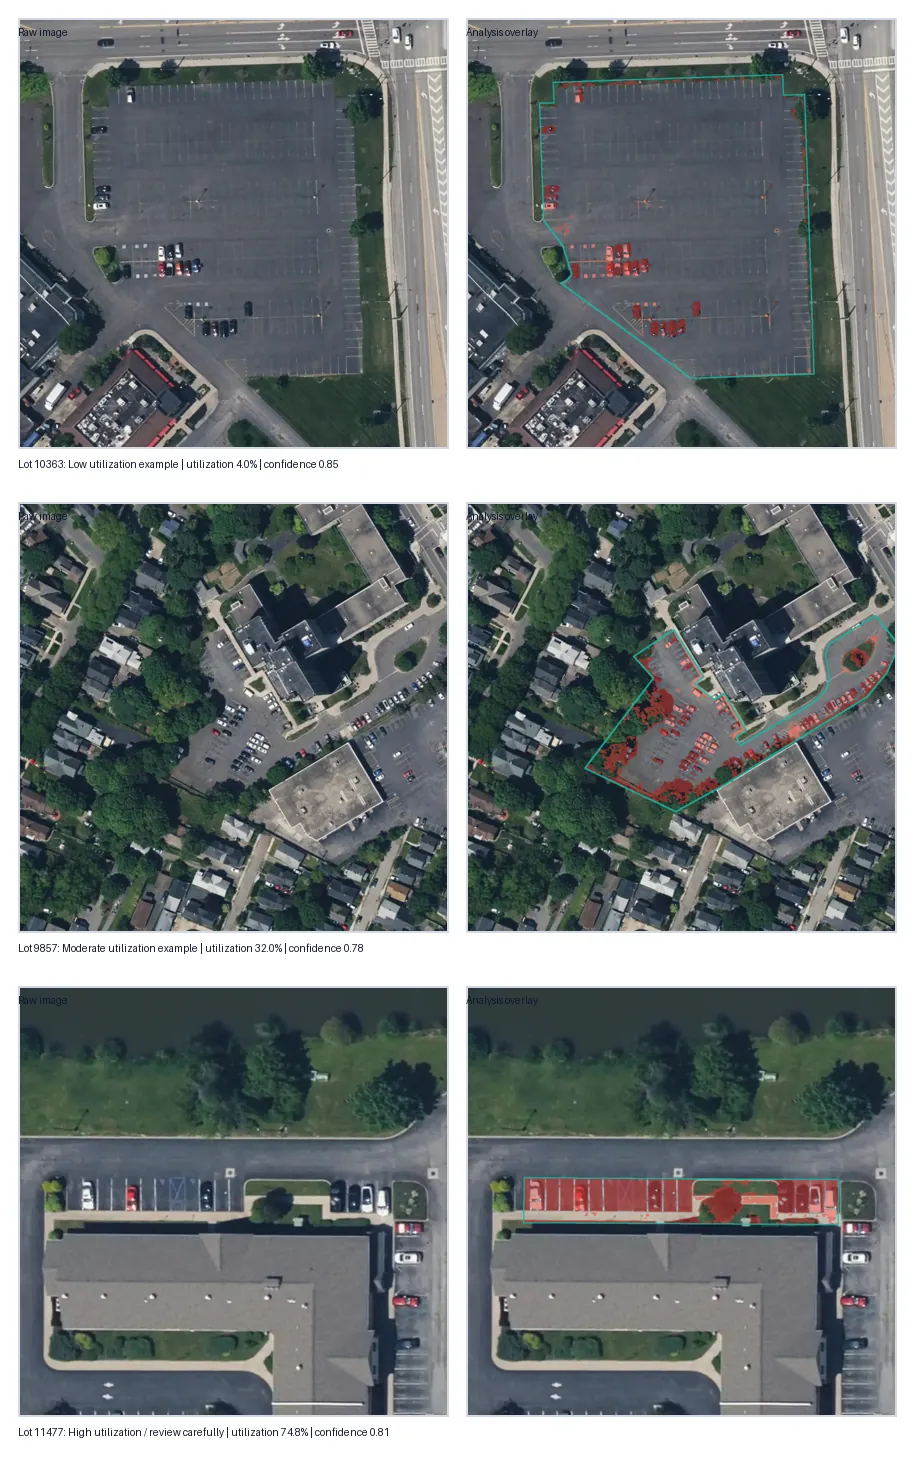
The teal outline in each overlay is the parking-lot mask used for the calculation. Red areas are detected non-asphalt anomalies inside that mask. The utilization score is the red anomaly area divided by the usable paved mask area, while confidence is a quality estimate rather than a guarantee that every red pixel is a vehicle.
A resumable county pipeline
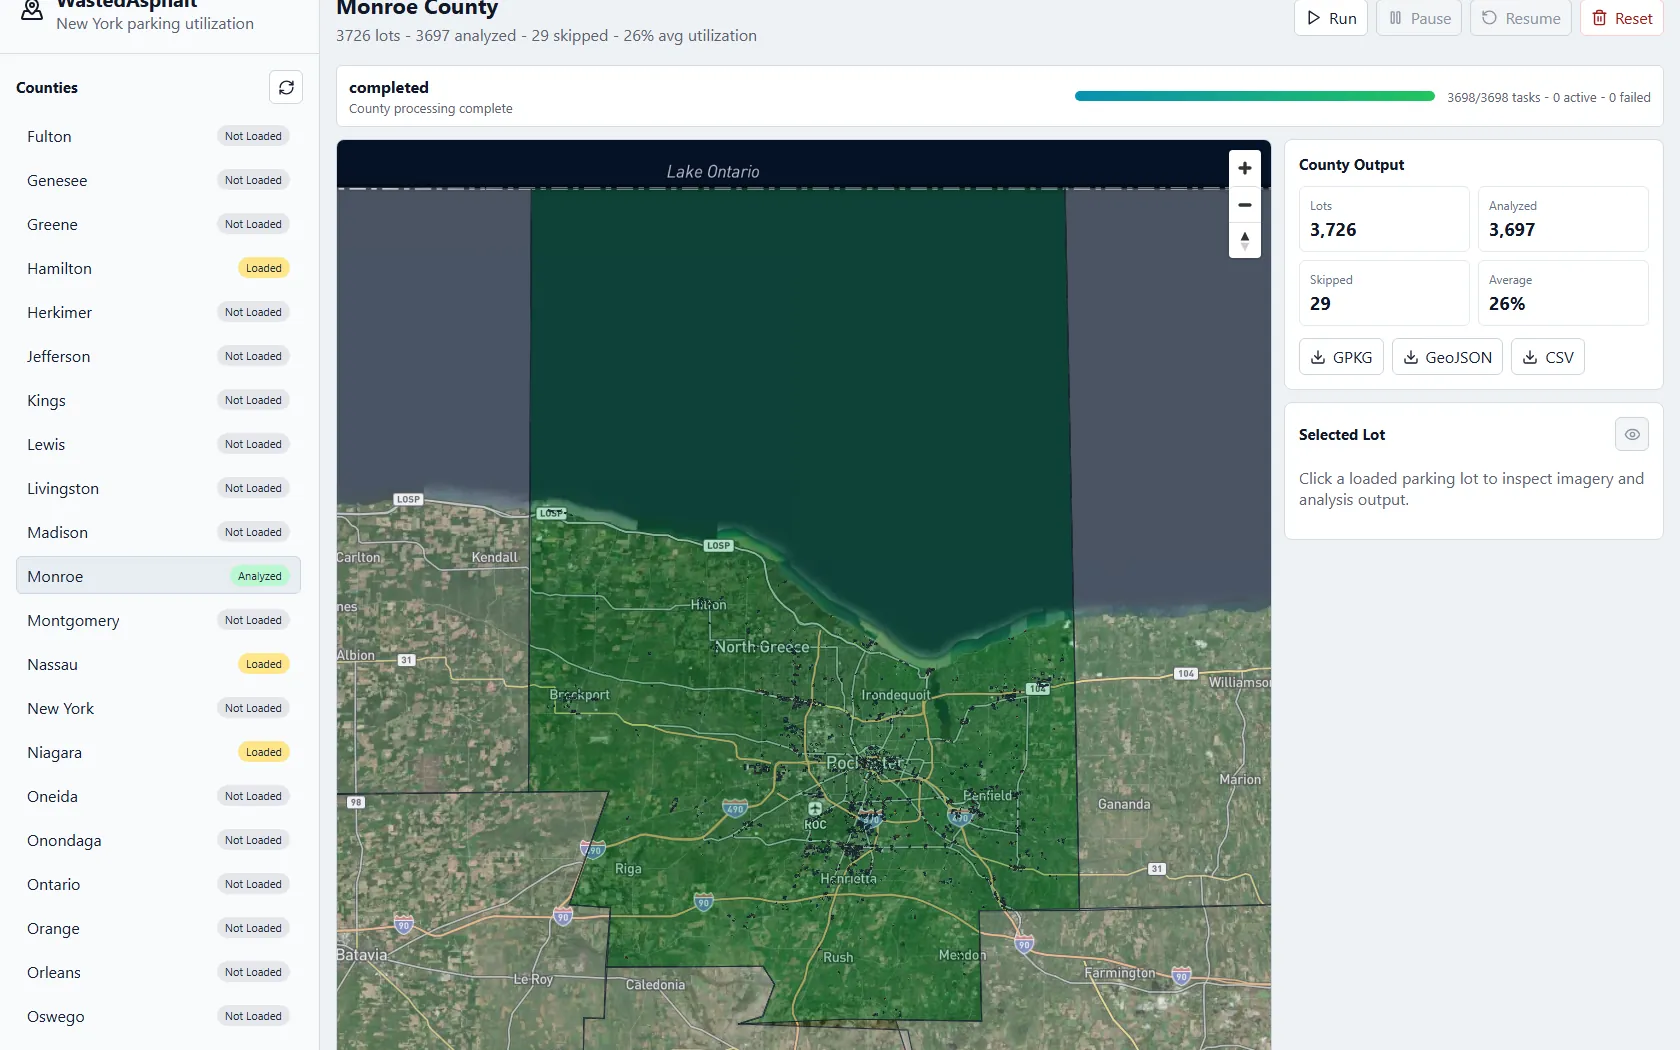
Every county, parking lot, imagery asset, result, job, and task is stored in a local SQLite database. Pause stops new tasks from being claimed while active workers finish. Resume reloads unfinished work, even after the backend has been closed and restarted.
Completed county results export as GeoPackage, GeoJSON, or CSV. GeoPackage is the best option for ArcGIS Pro; CSV includes WKT geometry for spreadsheet review or GIS import.
How to read the result
The current algorithm is a classical baseline, not a trained vehicle detector. It samples the lot's asphalt color, measures pixel differences, excludes likely vegetation and very dark shadows, removes small noise, and reports the remaining non-asphalt anomaly area.
Cars are the target anomaly, but painted markings, islands, glare, shadows, pavement repairs, roof edges, trailers, and incorrect OpenStreetMap polygons can still affect the score. The overlays make those problems visible, and confidence and analysis flags help filter weak records before county-scale GIS analysis.